


Governmentwide Gender and Racial/Ethnic Pay Gap Analysis Summary
Executive Summary
On June 25, 2021, President Biden signed Executive Order 14035 (86 FR 34593), titled “Diversity, Equity, Inclusion, and Accessibility in the Federal Workforce.” To address any pay inequities and advance equal pay, section 12 of EO 14035 required the Director of the Office of Personnel Management (OPM) to review Governmentwide regulations and, as appropriate and consistent with applicable law, consider prohibiting the use of an applicant’s salary history during the hiring process to set pay or when setting pay for a current Federal employee. On January 30, 2024, OPM issued final regulations to advance pay equity in Governmentwide pay systems (89 FR 5737). OPM shared high-level gender and racial/ethnic group pay gap data for September 2021 in the supplementary information accompanying the regulations. This report shares more detailed pay gap data, primarily for September 2022.
The gender pay gap for the Federal Government’s civilian workforce in 2022 was 5.6 percent, an improvement from 5.9 percent in 2021. The Federal gender pay gap is far smaller than the national gender pay gap, which sits at 16 percent. 1 From 1992 to 2022, the pay gap for the Federal workforce has decreased from 24.5 percent to the current 5.6 percent. In addition, in recent years women in the Senior Executive Service, the senior-most leadership ranks of the Federal Government, are paid approximately the same as their male counterparts.
OPM also conducted analysis regarding pay gaps for groups of employees identified by both gender and race/ethnicity. OPM calculated pay gaps comparing (1) women to men in the same racial/ethnic group to understand disparities by gender and (2) men and women in each racial/ethnic group compared to White men to understand overlapping disparities by gender and race/ethnicity. This analysis revealed that pay gaps varied significantly depending on the specific population.
Many factors may contribute to the overall gender and race/ethnicity pay gaps in the Federal Government. In conducting its data analysis, OPM observed evidence of some of these factors at play. For example, more women than men occupy positions classified at lower General Schedule (GS) grades with lower pay, while more men than women occupy positions classified at higher GS grades with higher pay.
This report summarizes OPM’s key findings. More detailed data is available in the appendices.
Footnote 1
U.S. Census Bureau. “Figure 6. Female-to-Male Earnings Ratio and Median Earnings of Full-Time, Year-Round Workers 15 Years and Older by Sex: 1960 to 2021.” https://www.census.gov/content/dam/Census/library/visualizations/2022/demo/p60-276/figure6.pdf
Background
Previous Pay Gap Data Analysis
As a result of EO 14035, OPM is building on previous work focused on the issue of gender pay equality. In 2014, OPM issued a Governmentwide Strategy to Advance Pay Equality in the Federal Government in response to a 2013 Presidential memorandum.2 OPM calculated the gender pay gap, which is the percentage difference between the average salaries of men and women, for 1992, 2002, and 2012. OPM also collected information agencies provided in response to an OPM data call memorandum.
OPM worked with agencies to implement all the recommendations in the Governmentwide strategy. These actions are summarized in a 2015 memorandum.3 OPM’s actions are also summarized in Appendix VI to GAO’s 2020 report “Gender Pay Differences: The Pay Gap for Federal Workers Has Continued to Narrow, but Better Data on Promotions Are Needed.”4 OPM has periodically updated its pay gap data analysis since issuing the 2014 Governmentwide strategy.
Data Sources
OPM used data reported by agencies to two OPM central data systems for the data analyses described in this report. These information systems are used to support statistical analyses of Federal personnel management programs. Data from the Enterprise Human Resources Integration—Statistical Data Mart (EHRI-SDM) was used for the analyses of the workforce starting in 2012. The Central Personnel Data File (CPDF), the predecessor system to EHRI-SDM, was used for the analyses of the 1992 and 2002 workforce. Most of the analysis results in this report focus on September 2022 data. Information on EHRI-SDM coverage is available on OPM’s web site.5
Both systems, EHRI-SDM and CPDF, are composed of two primary data files. The Status File documents the characteristics of employees (e.g., gender, race, salary, etc.) at a specific point in time. The Dynamics File documents personnel actions (e.g., accessions, separations, promotions, etc.) over a period of time. OPM’s analysis focused on data from the Status File.
Data Elements
OPM used certain data elements in CPDF and EHRI-SDM to define the population of interest. In general, the studied population was limited to—
- Employees employed in the Executive branch;
- Employees in a pay status;
- Employees with a “permanent” appointment (i.e., appointment without time limitation); and
- Employees with a nonseasonal full-time work schedule.
OPM separately analyzed as distinct populations the General Schedule system and the Federal Wage System, the major pay systems covering white-collar employees and blue-collar employees, respectively. “White Collar” refers to employees with the PATCO occupational codes (professional, administrative, technical, clerical, other). “Blue Collar” refers to employees with a blue-collar occupational category code (trade, craft, and laboring occupations). OPM used the Pay Plan data element to identify employees in the core pay plans within those two systems--codes GS, GL, and GM for the General Schedule and codes WG, WL, WS, WD, and WN for the Federal Wage System. Since the employee population in the core General Schedule pay plans (GS, GL, GM) makes up approximately 77 percent of the total white-collar employee population in September 2022, the core General Schedule is of special interest. Accordingly, OPM also presents separate data for those core General Schedule pay plans.6 As leaders in key positions just below the top Presidential appointees, we also present separate data for the Senior Executive Service. There is also some data for employees in Senior Level (SL) and Scientific or Professional (ST) positions.
OPM also used other data elements in CPDF and EHRI-SDM to define various subpopulations or subcategories. In this report, data elements used to create subpopulations are referred to as “factors.” Each data element or factor has a set of codes that define subpopulations within the context of the factor. For example, one factor is the employee’s agency. Codes identify different agencies. Each agency represents a subpopulation. For purposes of our study, we grouped together selected agencies—for example, smaller agencies were combined into a catch-all “other” category.
OPM used the following data elements as subpopulation-defining factors:
- Age
- Agency
- Grade (for General Schedule employees)
- Occupational series
- Pay plan (pay system)
- Race or national origin (ethnicity and race identification)
Detailed information regarding these data elements and associated codes for subpopulations can be found in the OPM Guide to Data Standards.7
Data for the Asian racial/ethnic group is combined with data for the Native Hawaiian/Pacific Islander racial/ethnic group.
OPM used the data element “Adjusted Basic Pay” in computing average salary rates for various subpopulations. Adjusted basic pay includes base pay plus any applicable locality payment or special rate supplement.
Calculations
In comparing female salaries to male salaries, OPM used male salaries as the base for comparison. Thus, in this report, OPM expresses the average female salary as a percentage of the average male salary. For example, for the total Executive branch population in September 2022, the average female salary was 94.4 percent of the average male salary. The shorthand term used in this report for this percentage is the “female salary percentage.” In addition, the gender pay disparity or “pay gap” is expressed in this report as a percentage by (1) subtracting the average male salary from the average female salary and (2) dividing the resulting difference by the average male salary. If the female salary percentage is already computed, 100 percent is subtracted from the female salary percentage to derive the pay gap percentage. For example, if the female salary percentage is 94.4 percent, the pay gap is –5.6 percent (94.4 – 100 = –5.6). In other words, the average female salary is 5.6 percent below the average male salary.8 (In this report, we show the overall pay gap as a positive number, since it is understood that the gap represents the degree to which female pay is below male pay, unless the female average salary exceeds the male average salary.)
Similarly, in comparing salaries for different racial/ethnic groups for males and females, generally OPM used White male salaries as the base for comparison. Thus, in this report, OPM expresses the average salary for a certain ethnic/racial group and gender as a percentage of the average White male salary. For example, for the total Executive branch population in September 2022, the average Black/African American female salary was 85.1 percent of the average White male salary. In addition, the pay disparity or “pay gap” for males and females in each racial/ethnic group is expressed in this report as a percentage by (1) subtracting the average White male salary from the average male or female salary for the racial/ethnic group and (2) dividing the resulting difference by the average White male salary. If the percentage of White male average salary is already computed, 100 percent is subtracted from that percentage to derive the pay gap percentage. For example, if the Black/African American female percentage of White male salary is 85.1 percent, the pay gap is –14.9 percent (85.1 – 100 = –14.9). In other words, the average Black/African American female salary is 14.9 percent below the average White male salary. (In this report, OPM shows the overall pay gap as a positive number, since it is understood that the gap represents the degree to which male and female pay for each racial/ethnic group is below White male pay, unless the male or female pay for the racial/ethnic group exceeds White male pay.) OPM also calculated gender pay gaps by racial/ethnic groups comparing females to males in the same racial/ethnic group using the calculation described in the previous paragraph.
Footnote 2
Office of Personnel Management. “Governmentwide Strategy on Advancing Pay Equality in the Federal Government,” April 2014. https://www.opm.gov/policy-data-oversight/pay-leave/reference-materials/reports/Governmentwide-Strategy-on-Advancing-Pay-Equality-in-the-Federal-Government.pdf
Footnote 3
Office of Personnel Management. “Additional Guidance on Advancing Pay Equality in the Federal Government,” July 2015. https://www.chcoc.gov/content/additional-guidance-advancing-pay-equality-federal-government
Footnote 4
Government Accountability Office. “Gender Pay Differences: The Pay Gap for Federal Workers Has Continued to Narrow, but Better Data on Promotions Are Needed,” December 2020. https://www.gao.gov/products/gao-21-67 (GAO notes on its website that the one recommendation from the report for the Equal Employment Opportunity Commission was implemented and has been closed. There were no recommendations for OPM.)
Footnote 5
Office of Personnel Management. “About Our Data (EHRI-SDM).” https://www.fedscope.opm.gov/datadefn/aehri_sdm.asp
Footnote 6
The General Schedule system also includes pay plans GP and GR, which cover doctors and dentists receiving title 38 market pay. Since the pay levels for GP-GR employees are dramatically higher than those for GS-GL-GM employees, after the GP and GR codes took effect in 2006, we have not included them with the core General Schedule plans that were separately analyzed. All General Schedule doctors and dentists were included in the core system (GS-GL-GM) in study years 1992 and 2002.
Footnote 7
Office of Personnel Management. “Guide to Data Standards”. https://www.opm.gov/policy-data-oversight/data-analysis-documentation/data-policy-guidance/#url=Data-Standards
Footnote 8
The gender pay gap would be slightly larger if the gap represented the amount by which the average female salary would need to increase to match the average male salary. For example, 5.6 percent divided by 94.4 percent equals 5.9 percent.
OPM’s Data Analysis Findings
This section summarizes the detailed data tables in each of the appendices to this report. Selected, key data tables from the appendices are also shown as graphs in this section.
Federal Gender Pay Gaps and Related Data Over Time
Table 1a in Appendix 1 shows the female-to-male salary percentage for the Federal Government’s civilian workforce over time. The female-to-male salary percentage is the female average salary as a percentage of male average salary.
Table 1b in Appendix 1 shows the gender pay gaps for the Federal Government’s civilian workforce over time. The pay gap percentage is the percentage that female average salary is below male average salary.
The tables begin with data OPM collected for its 2014 Governmentwide Strategy on Advancing Pay Equality in the Federal Government (1992-2002-2012 study years) and continue with pay gap analysis OPM has conducted since then. The tables show data for White Collar, General Schedule, Senior Executive Service, Blue Collar, and Total Executive Branch populations. “White Collar” includes all white collar employees, including those in the General Schedule and Senior Executive Service. “Blue Collar” includes all blue collar employees, including those in the Federal Wage System.
The gender pay gap for the Executive branch has dramatically shrunk from 24.5 percent in 1992 to 5.6 percent in 2022. There have been large decreases for White Collar and General Schedule populations. The Blue Collar pay gap has fluctuated slightly over time and there is almost no pay gap in the Senior Executive Service in recent years. Table 1b gender pay gap data are represented in the graph below.
Gender Pay Gaps for the Federal Government

Female Distribution & Pay Gaps by Federal Government Civilian Occupational Group or Pay System
Appendix 2 shows overall data for White Collar, General Schedule, Senior Executive Service, Blue Collar, and Total Executive Branch populations for September 2022, including percentage of male and female employees (as shown in the graph below), male and female average salaries, and overall pay gaps.
While Senior Executive Service has almost no pay gap, the percentage of females in the Senior Executive Service is 39.3 percent, which is less than the percentage of females in the entire Executive Branch (44.1 percent). The Blue Collar pay system, which has the largest pay gap of the pay system categories studied (17.4 percent), has the smallest percentage of females (11.1 percent).
Percentage of Employees in the Executive Branch by Gender
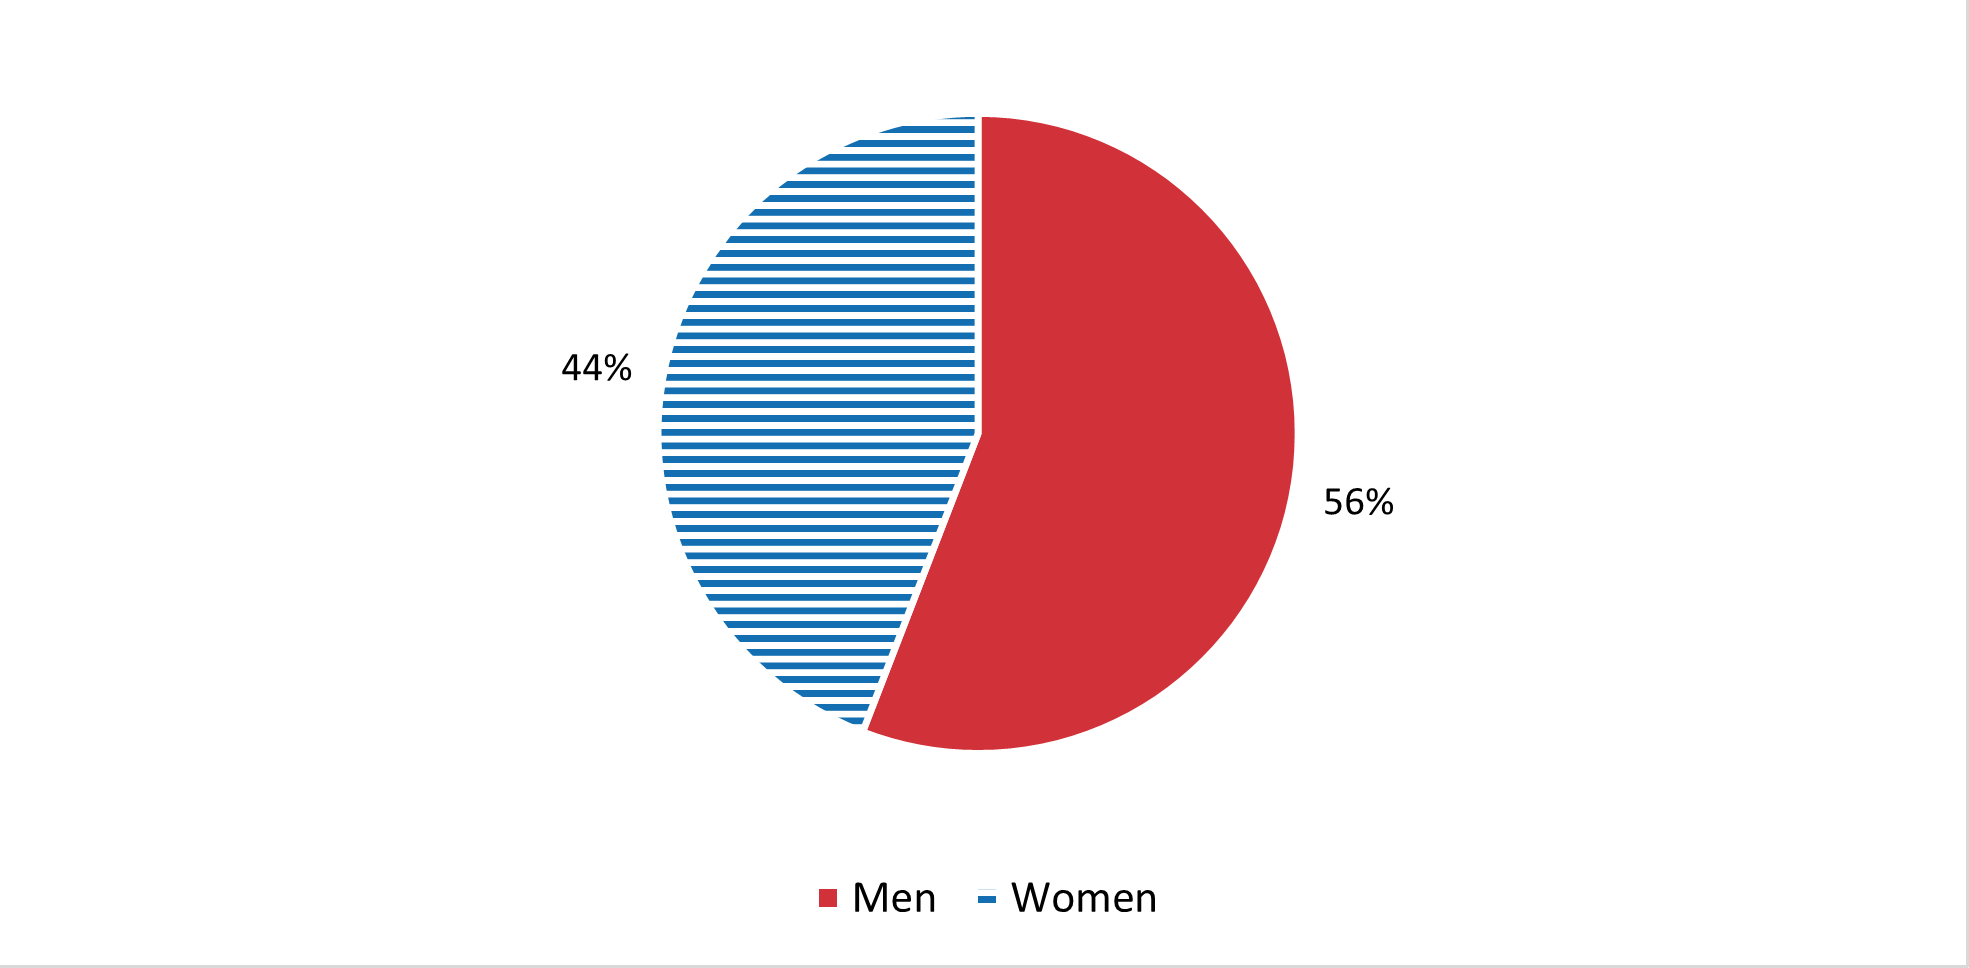
Source: EHRI-SDM. Nonseasonal, full-time, permanent Executive branch employees in a pay status.
Gender Pay Gaps by Subpopulation
Appendix 3 shows gender pay gaps by the following factors: age range, agency, GS grade level, and racial/ethnic group. Data for each of the four factors is shown in separate Tables 3a-3d in Appendix 3. Each table provides data on (1) subpopulations as percentage of total population (e.g., what percentage each racial/ethnic group is of all racial/ethnic groups), (2) percentage of each subpopulation that is female, and (3) female average salary as percentage of male average salary for each subpopulation.
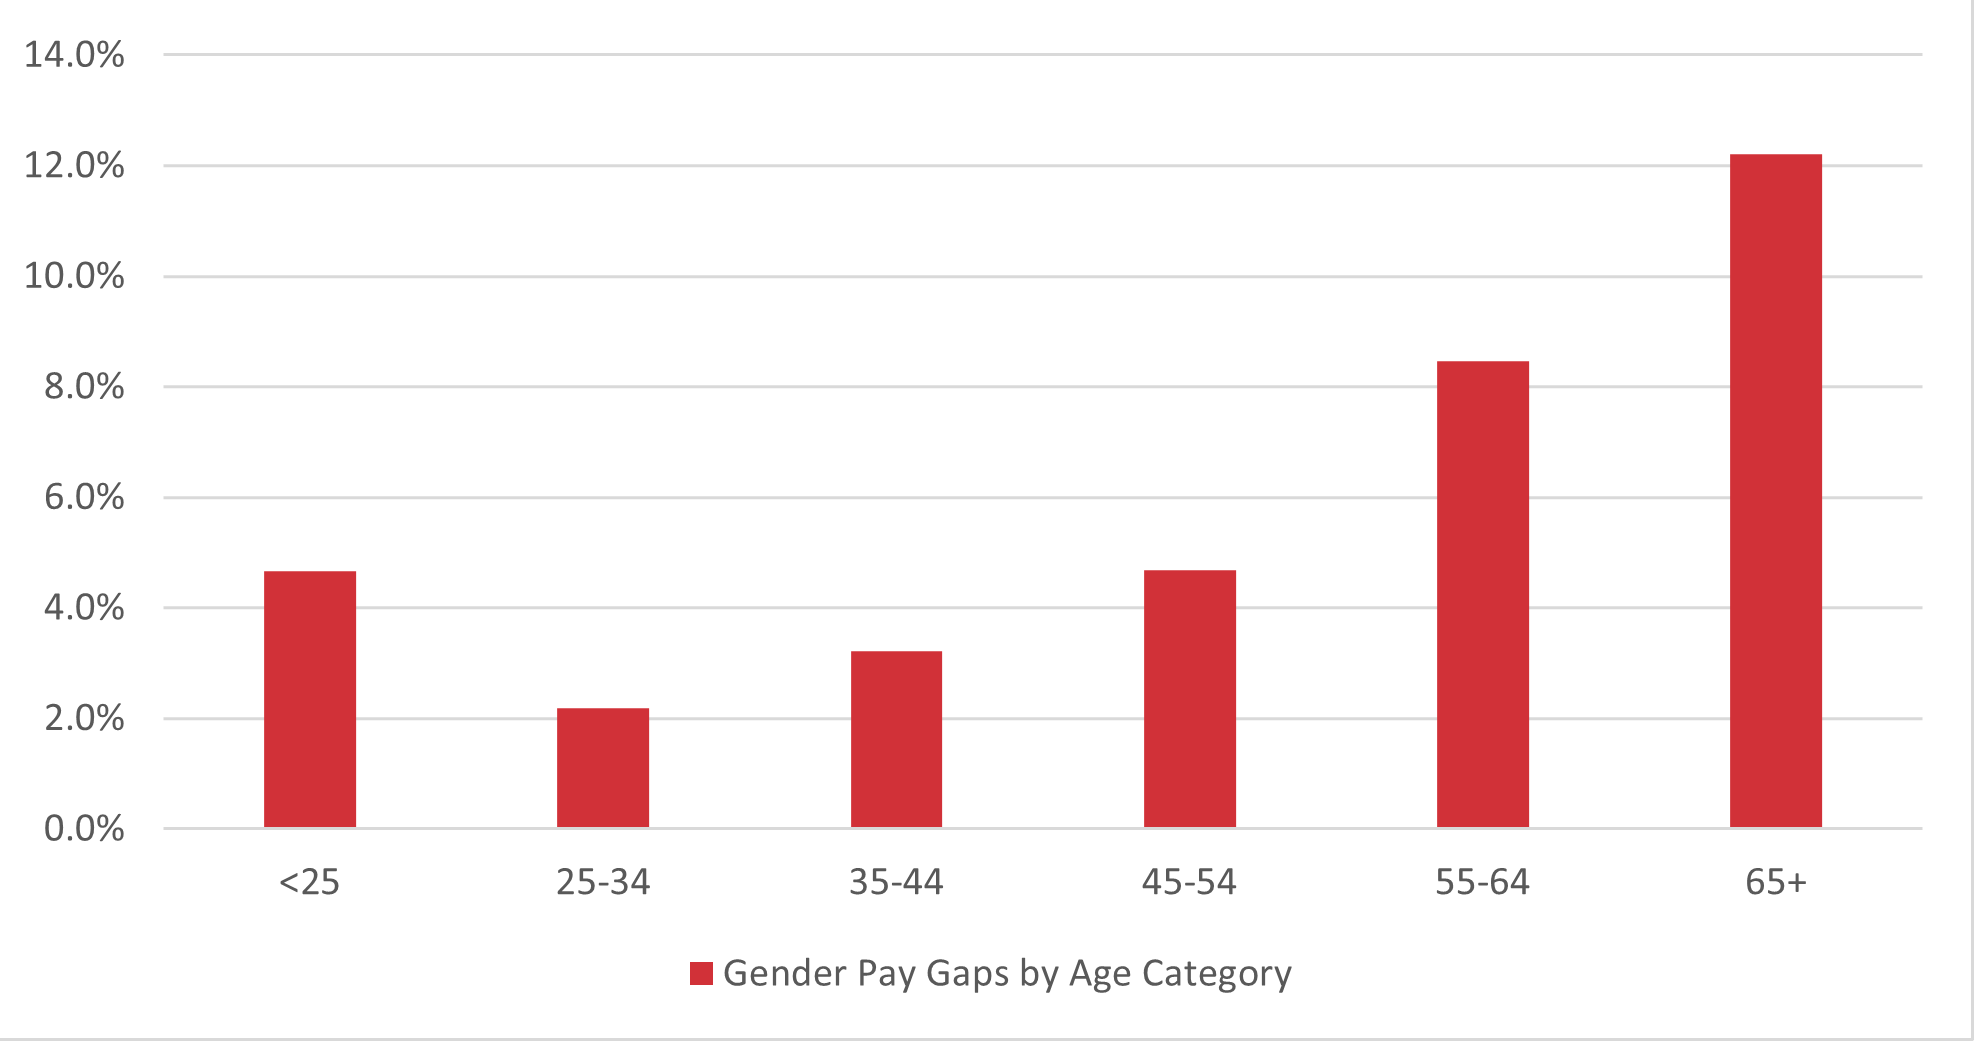
There are varying differences (some significant) in the female salary percentages across subpopulations. Given the significance of the occupation series factor (see Appendix 5), the differences in female salary percentages for subpopulations of non-occupation-related factors may reflect—to a significant degree—the varying occupational distribution of employees in the different subpopulations. For example, the female salary percentage was 97.8 percent (a pay gap of 2.2 percent) for the subpopulation of employees who are in the 25-34 age range and was 91.5 percent (a pay gap of 8.5 percent) for those in the 55-64 age range (see Table 3a of Appendix 3 and the graph below). These two subpopulations likely have significantly different occupational distributions. Similarly, differences in subpopulations for different agencies may largely reflect the difference in occupational distribution among those agencies. (See Table 3b of Appendix 3.)
Gender Pay Gaps by Age Category
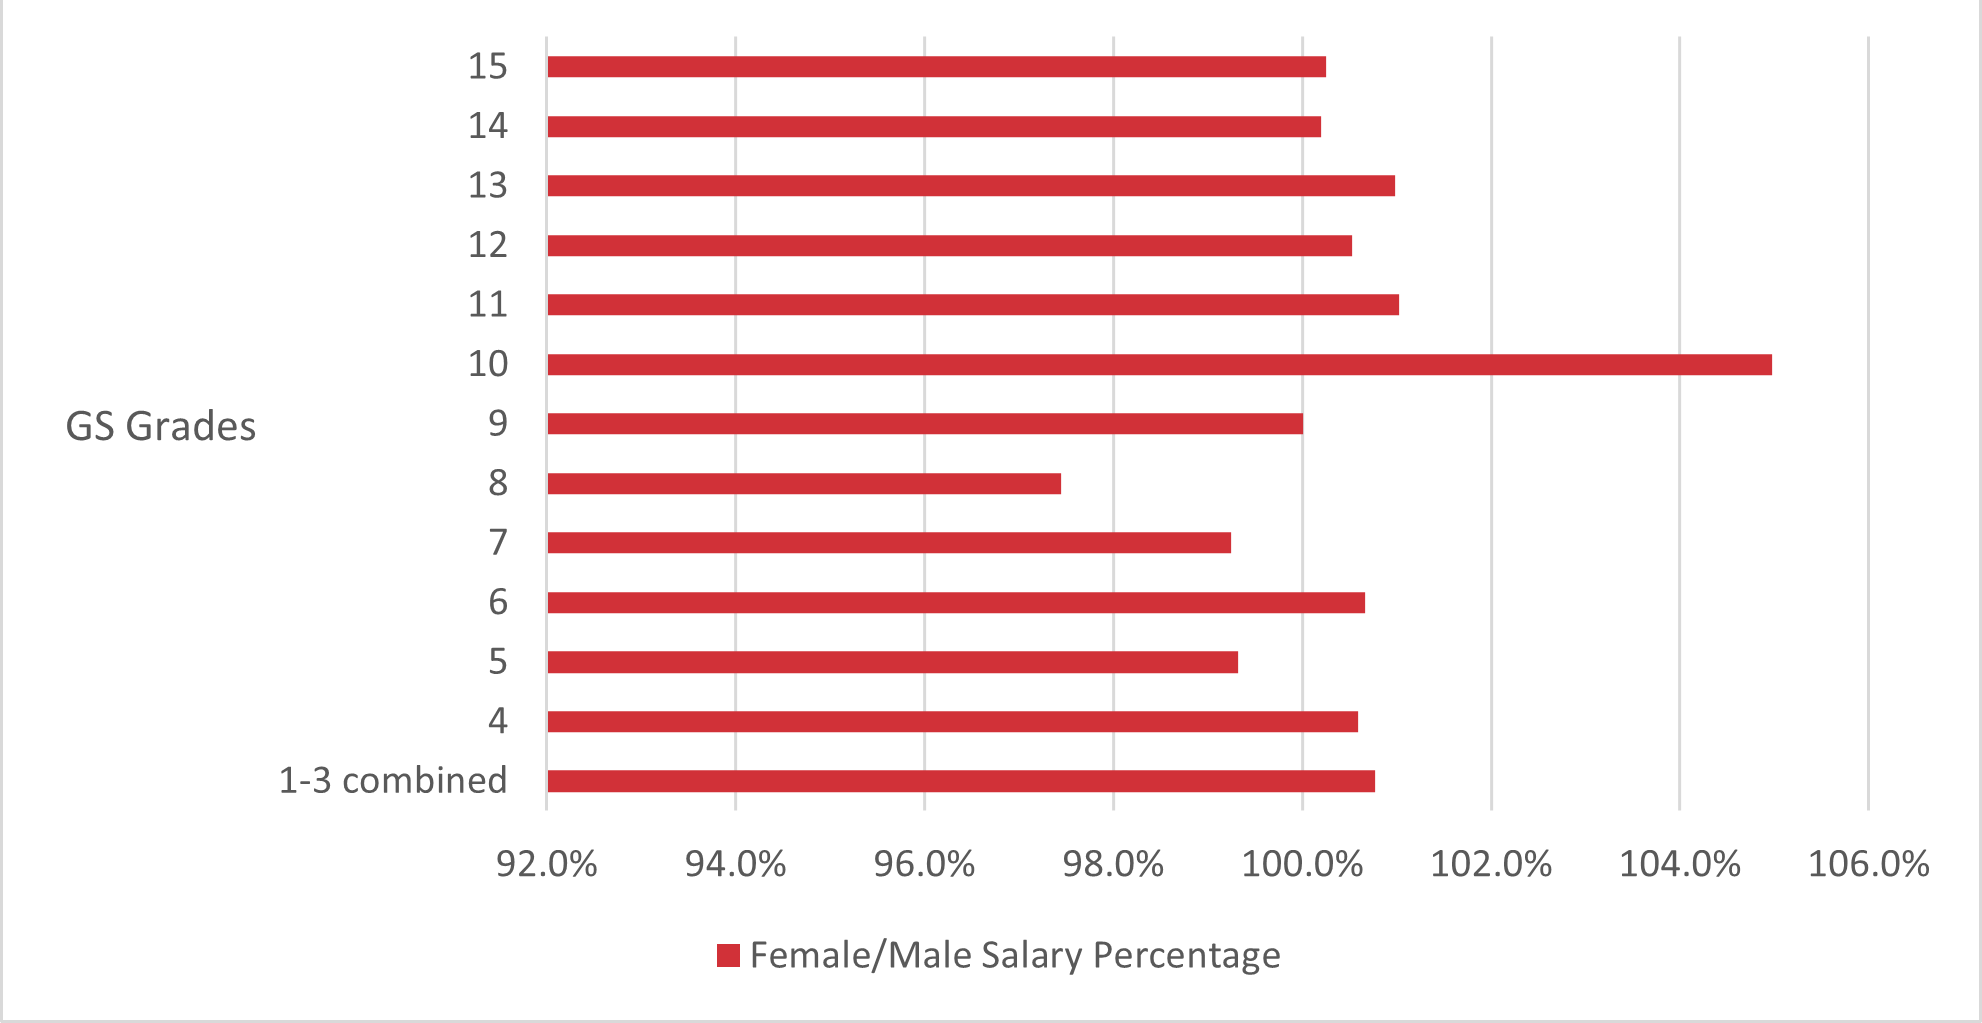
Under the GS Grade Level factor, we see that 10 out of 13 grade levels showed the female average salary as equal to or higher than the male average salary. (See Table 3c of Appendix 3 and the graph below.) The remaining female salary percentages were 99.3 or a less than 1 percent pay gap (grade 5 and grade 7) and 97.4 or a 2.6 percent pay gap (grade 8). These data indicate that, for each GS grade, females and males had close to the same average position in range (average step position). The explanation for the difference in the overall female salary percentage for the General Schedule of 91.1 percent (see Table 1a in Appendix 1) and these subpopulation percentages near 100 percent is that relatively more females were found in lower grades, which appears to reflect differences in occupational distribution. For grades 1-8, the number of females exceeded the number of males, with the percentage of employees who were female ranging from about 52 to 71 percent. At grades 9-15, the percentage of employees who were female ranged from about 42 to 50 percent. Grades directly link to pay ranges—i.e., there are generally lower pay rates and ranges at lower grades and higher pay rates and ranges at higher grades. Thus, grade is the primary driver of average pay levels.
Female/Male Salary Percentage for GS Grades
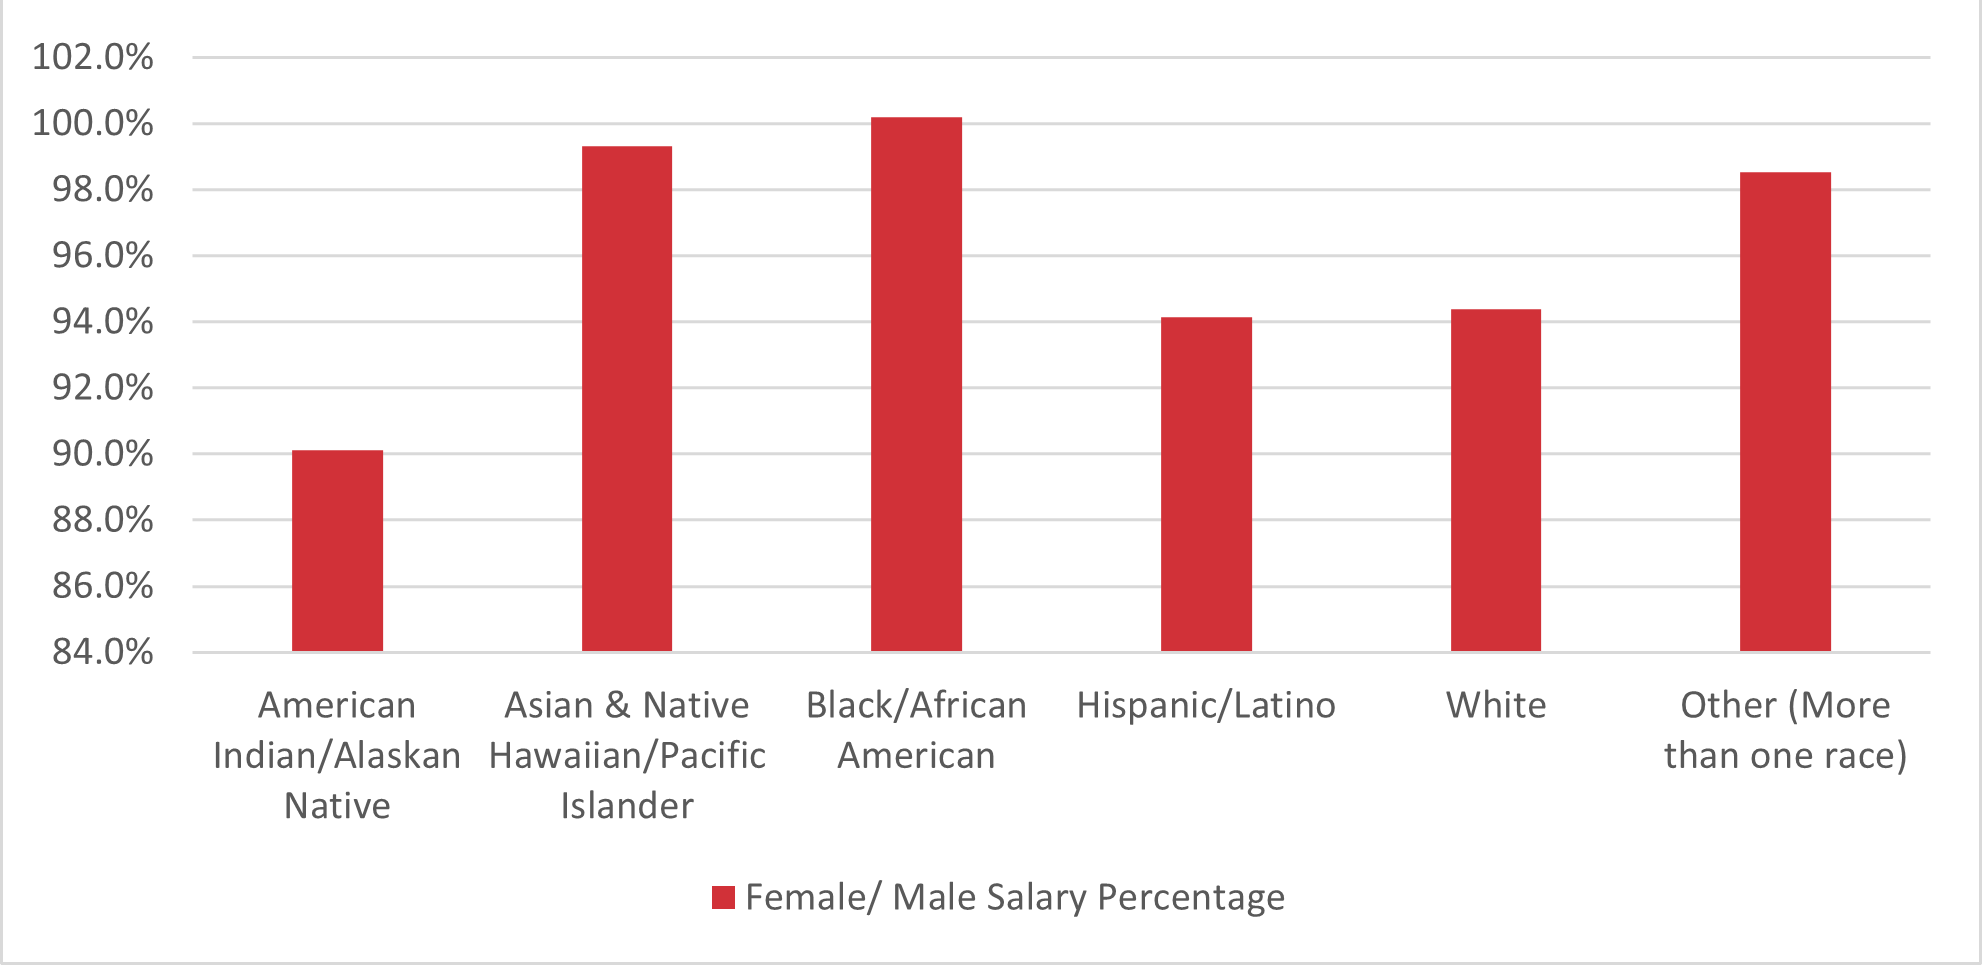
Under the Racial/Ethnic Groups factor, we see the largest pay gap between males and females in the American Indian or Alaskan Native racial/ethnic group, which also had the smallest percentage of the total population. (See Table 3d of Appendix 3 and the graph below.) In the Black/African American racial/ethnic group, the female average salary was slightly higher than the male average salary.
Female/Male Salary Percentage for Each Racial/Ethnic Group
Footnote 9
Due to the small populations for grades 1, 2, and 3, those grades were merged to form a single subpopulation; resulting in 13 grade levels instead of 15.
Detailed Data by Occupational Series
Appendix 4 shows detailed data for subpopulations under the Occupational Series factor in 2022—i.e., the female/male average salary percentages and pay gaps for specific occupational series. Appendix 4 also shows the population-weighted average salary percentage as a contrast to the overall raw salary percentage. The population-weighted average can shed light on the effect of the varying male-female distribution across occupational series.
The population-weighted average salary percentages were 98.0 percent for All White Collar (Table 4a of Appendix 4), 98.2 percent for the General Schedule (Table 4c of Appendix 4), 94.9 percent for Blue Collar employees (Table 4e of Appendix 4), and 97.8 percent for the Executive branch (Table 4g of Appendix 4). These percentages were close to 100 percent and above the corresponding overall raw female salary percentages. This indicates that male-female distributions across the occupational series groups appear to explain much of the overall gender pay disparity. Appendix 4 also summarizes data on female/male salary percentages by occupational group. For White Collar employees, for 94 out of the 330 occupational groups (28 percent), the female average salary equaled or exceeded the male average salary (i.e., equal to or greater than 100 percent). For an additional 153 occupational groups (46 percent), the female salary percentage was 95-99.9 percent. For 83 occupational groups (25 percent), the female salary percentage was less than 95 percent. (See Table 4b of Appendix 4.)
For the General Schedule, for 86 out of the 313 occupational groups (27 percent), the female average salary equaled or exceeded the male average salary (i.e., equal to or greater than 100 percent). For an additional 156 occupational groups (50 percent), the female average salary percentage was 95-99.9 percent. For 71 occupational groups (23 percent), the female salary percentage was less than 95 percent. (See Table 4d of Appendix 4.)
For Blue Collar employees, for 33 out of the 142 occupational groups (23 percent), the female average salary equaled or exceeded the male average salary (i.e., equal to or greater than 100 percent). For an additional 58 occupational groups (41 percent), the female average salary percentage was 95-99.9 percent. For 51 occupational groups (36 percent), the female salary percentage was less than 95 percent. (Data is redacted when occupations have fewer than 10 females.) (See Table 4f of Appendix 4.)
For Executive branch employees, 128 out of the 471 occupational groups (27 percent), the female average salary equaled or exceeded the male average salary (i.e., equal to or greater than 100 percent). For an additional 210 occupational groups (45 percent), the female average salary percentage was 95-99.9 percent. For 133 occupational groups (28 percent), the female salary percentage was less than 95 percent. (See Table 4h of Appendix 4.)
Summary of Population-Weighted Averages by Factor
Appendix 5 shows a summary of female average salary as a percentage of male average salary for various factors, where the percentage is a population-weighted average that reflects the relative size of the subpopulations for each factor.
For example, for the Age factor, there are age ranges (e.g., 25-34, 35-44) that define subpopulations for the factor. For each subpopulation, female average salary is expressed as a percentage of male average salary. A weighted average is computed using the size of each subpopulation as a percentage of the total population. This weighted average can shed light on the effect of the varying male-female distribution across subpopulation categories. The population-weighted average should be compared to the overall raw average for the given snapshot date.
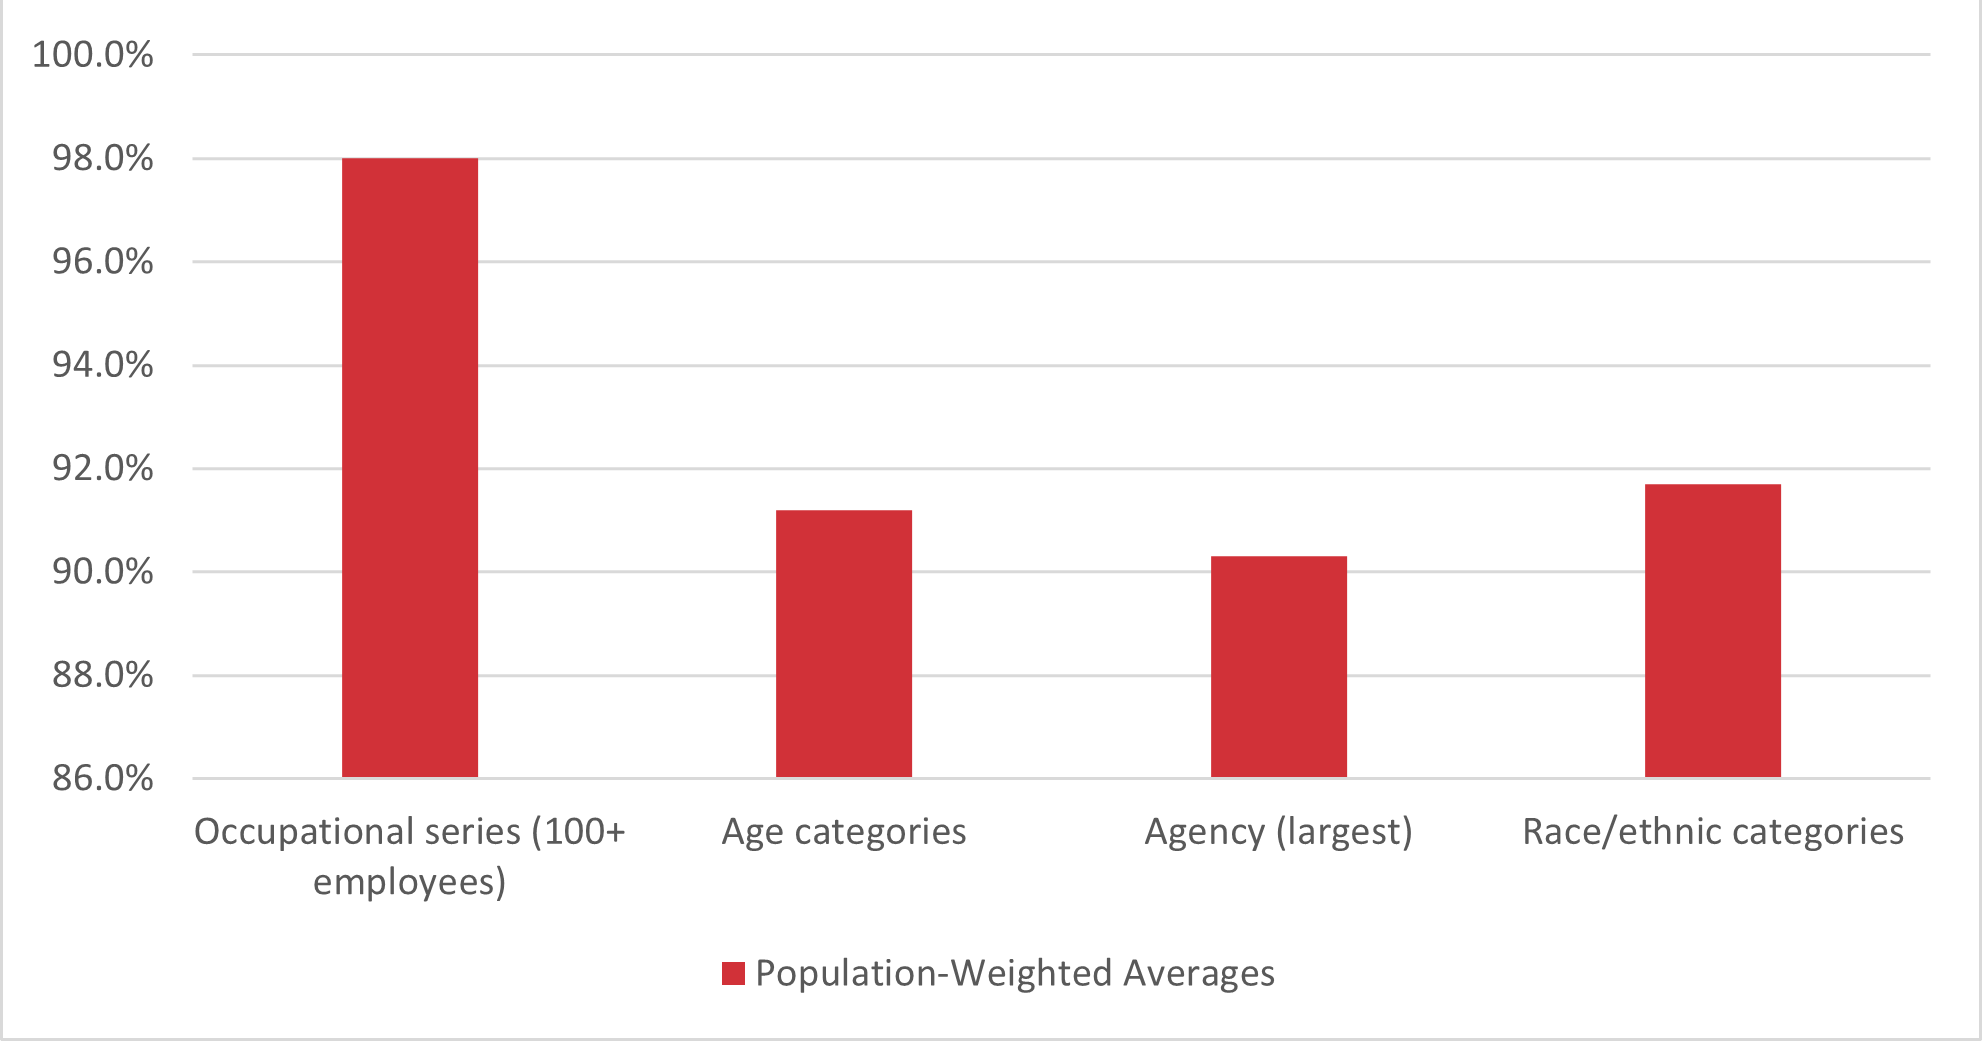
The factor based on occupational series produced the highest population-weighted averages. (See also the graph below.) In 2022, the weighted average for the Occupational Series factor of 98.0 percent for White Collar employees, which is about 7 percentage points above the corresponding overall raw average of 90.5 percent (see Table 5b of Appendix 5). This data suggests that specific occupation series explain much of the gender pay disparity.
After the occupation series factor, the Race/Ethnic categories factor produced the highest population-weighted average for White Collar and General Schedule employees. OPM studied pay gaps by racial/ethnic group separately. (See Appendices 6-11.)
Population-Weighted Averages for White Collar Employees
Male and Female Pay Gaps Relative to White Males by Racial/Ethnic Group
Appendix 6 shows male and female average salaries for each racial/ethnic group and pay gaps relative to White males for White Collar, General Schedule, Senior Executive Service, Senior Level/ Scientific or Professional, Blue Collar, and Total Executive Branch populations in September 2022.
In the Executive Branch, the average salary for males and the average salary for females in the Asian & Native Hawaiian/Pacific Islander racial/ethnic group exceeded the average salary for White Males. The pay gaps for males and females in the other racial/ethnic groups ranged from 5.6 percent for White females to 26.2 percent for American Indian/Alaskan Native females. (See Table 6a of Appendix 6.)
In the General Schedule, the average salary for males in the Asian & Native Hawaiian/Pacific Islander racial/ethnic group exceeded the average salary for White males. The pay gaps for other males and females in the other racial/ethnic groups compared to White males ranged from 1.0 percent for Asian & Native Hawaiian/Pacific Islander females to 27.6 percent for American Indian/Alaskan Native females. (See Table 6b of Appendix 6.)
For White Collar employees, the average salary for males and females in the Asian & Native Hawaiian/Pacific Islander racial/ethnic group exceeded the average salary for White Males. The pay gaps for males and females in the other racial/ethnic groups compared to White males ranged from 9.6 percent for White females to 28.8 percent for American Indian/Alaskan Native females. (See Table 6c of Appendix 6.)
For Blue Collar employees, the average salary for males in the Asian & Native Hawaiian/Pacific Islander racial/ethnic group exceeded the average salary for White males. The pay gaps for other males and females in the other racial/ethnic groups compared to White males ranged from 0.7 percent for Other (more than one race) males to 29.3 percent for American Indian/Alaskan Native females. (See Table 6d of Appendix 6.)
For the Senior Executive Service, pay gaps ranged from 0.5 percent for Black/African American males to 3.5 percent for Other (more than one race) males compared to White males. (See Table 6e of Appendix 6.)
For Senior Level/Scientific or Professional employees, the average salary for Asian & Native Hawaiian/Pacific Islander females exceeded the average salary for White males. Pay gaps for the other racial/ethnic groups compared to White males ranged from 0.3 percent for Asian & Native Hawaiian/Pacific Islander males and Hispanic/Latino males to 2.7 percent for Hispanic/Latino females. Some data is not shown due to small population size. (See Table 6f of Appendix 6.)
Footnote
Not shown due to small population size
Summary of Male and Female Distributions in Each Racial/Ethnic Group
For each analyzed population (Executive branch, SES, and SL/ST), Appendix 7 shows male and female employment counts in each racial/ethnic group, percentage of males in each racial/ethnic group, percentage of females in each racial/ethnic group, the percentage of the total population that is in each racial/ethnic group, and the distribution of males and females in each racial/ethnic group across the total population.
About 61 percent of Executive branch employees identified as belonging to the White racial/ethnic group. About 19 percent of Executive branch employees identified as belonging to the Black/African American racial ethnic group. The other racial/ethnic groups each comprised less than 10 percent of the Executive branch population. (See Table 7a of Appendix 7.)
There is less diversity in the Senior Executive Service and Senior Level/Scientific or Professional populations. About 74 percent of the Senior Executive Service and 82 percent of the Senior Level/Scientific or Professional population identified as belonging to the White racial/ethnic group, respectively. In addition, the percentage of those populations that are male was also higher compared to the Executive branch as a whole (61 percent of the Senior Executive Service population and 71 percent of the Senior Level/Scientific or Professional population are male, respectively, compared to 56 percent of the Executive branch population that are male). (See Table 7b and Table 7c of Appendix 7.)
In the Executive branch, there are more females than males in the American Indian/Alaskan Native and Black/African American racial/ethnic groups. The other racial ethnic groups have more males than females. (See Table 7a of Appendix 7.)
Population-Weighted Average Percent of White Male Salary for Each Racial/Ethnic Group
Appendix 8 shows averages that are weighted based on White Collar occupational series population percentages. These are calculated by dividing the number of employees in a given racial/ethnic group who are in each occupation by the total number of employees in the given racial/ethnic group; each population percentage is then multiplied by the Percent-of-White Male Average Salary for each occupation and all the results are summed to derive the population-weighted average percent-of-White-male average salary. Appendix 8 also shows corresponding pay gap percentages derived by subtracting the population-weighted average percent-of-White-male average salary from 100 percent.
In most cases, the averages that are weighted based on occupation population percentages are greater than the corresponding raw percentages of White male average salary, resulting in smaller pay gaps. For example, the White Collar occupation population-weighted average pay gap for American Indian/Alaskan Native females relative to White males is 8.1 percent compared to the raw pay gap of 28.8 percent relative to White males. (See Appendix 6, Table 6c.) This data suggests that the distribution of employees across occupation series explains some of the gender and racial/ethnic pay disparity.
Number and Percentage of GS Employees by Grade and Racial/Ethnic Group
Appendix 9 shows the number and percentage of General Schedule employees at various grades by each racial/ethnic group. In other words, the percentages represent the percent of employees out of the total number in a given racial/ethnic group that are at a given grade. For example, 20 percent for White employees at GS-13 means that 20 percent of White employees are in the GS-13 grade. GS-12 is the most populous grade for each racial/ethnic group.
There is a higher concentration of employees at lower GS grades in the American Indian/Alaskan Native racial/ethnic group than appears in the other racial/ethnic groups. This data suggests that higher employment at the lower grades partly explains the large pay gap for the American Indian/Alaskan Native racial/ethnic group compared to White males.
Percentage of General Schedule Employees by Grade and Racial/Ethnic Group
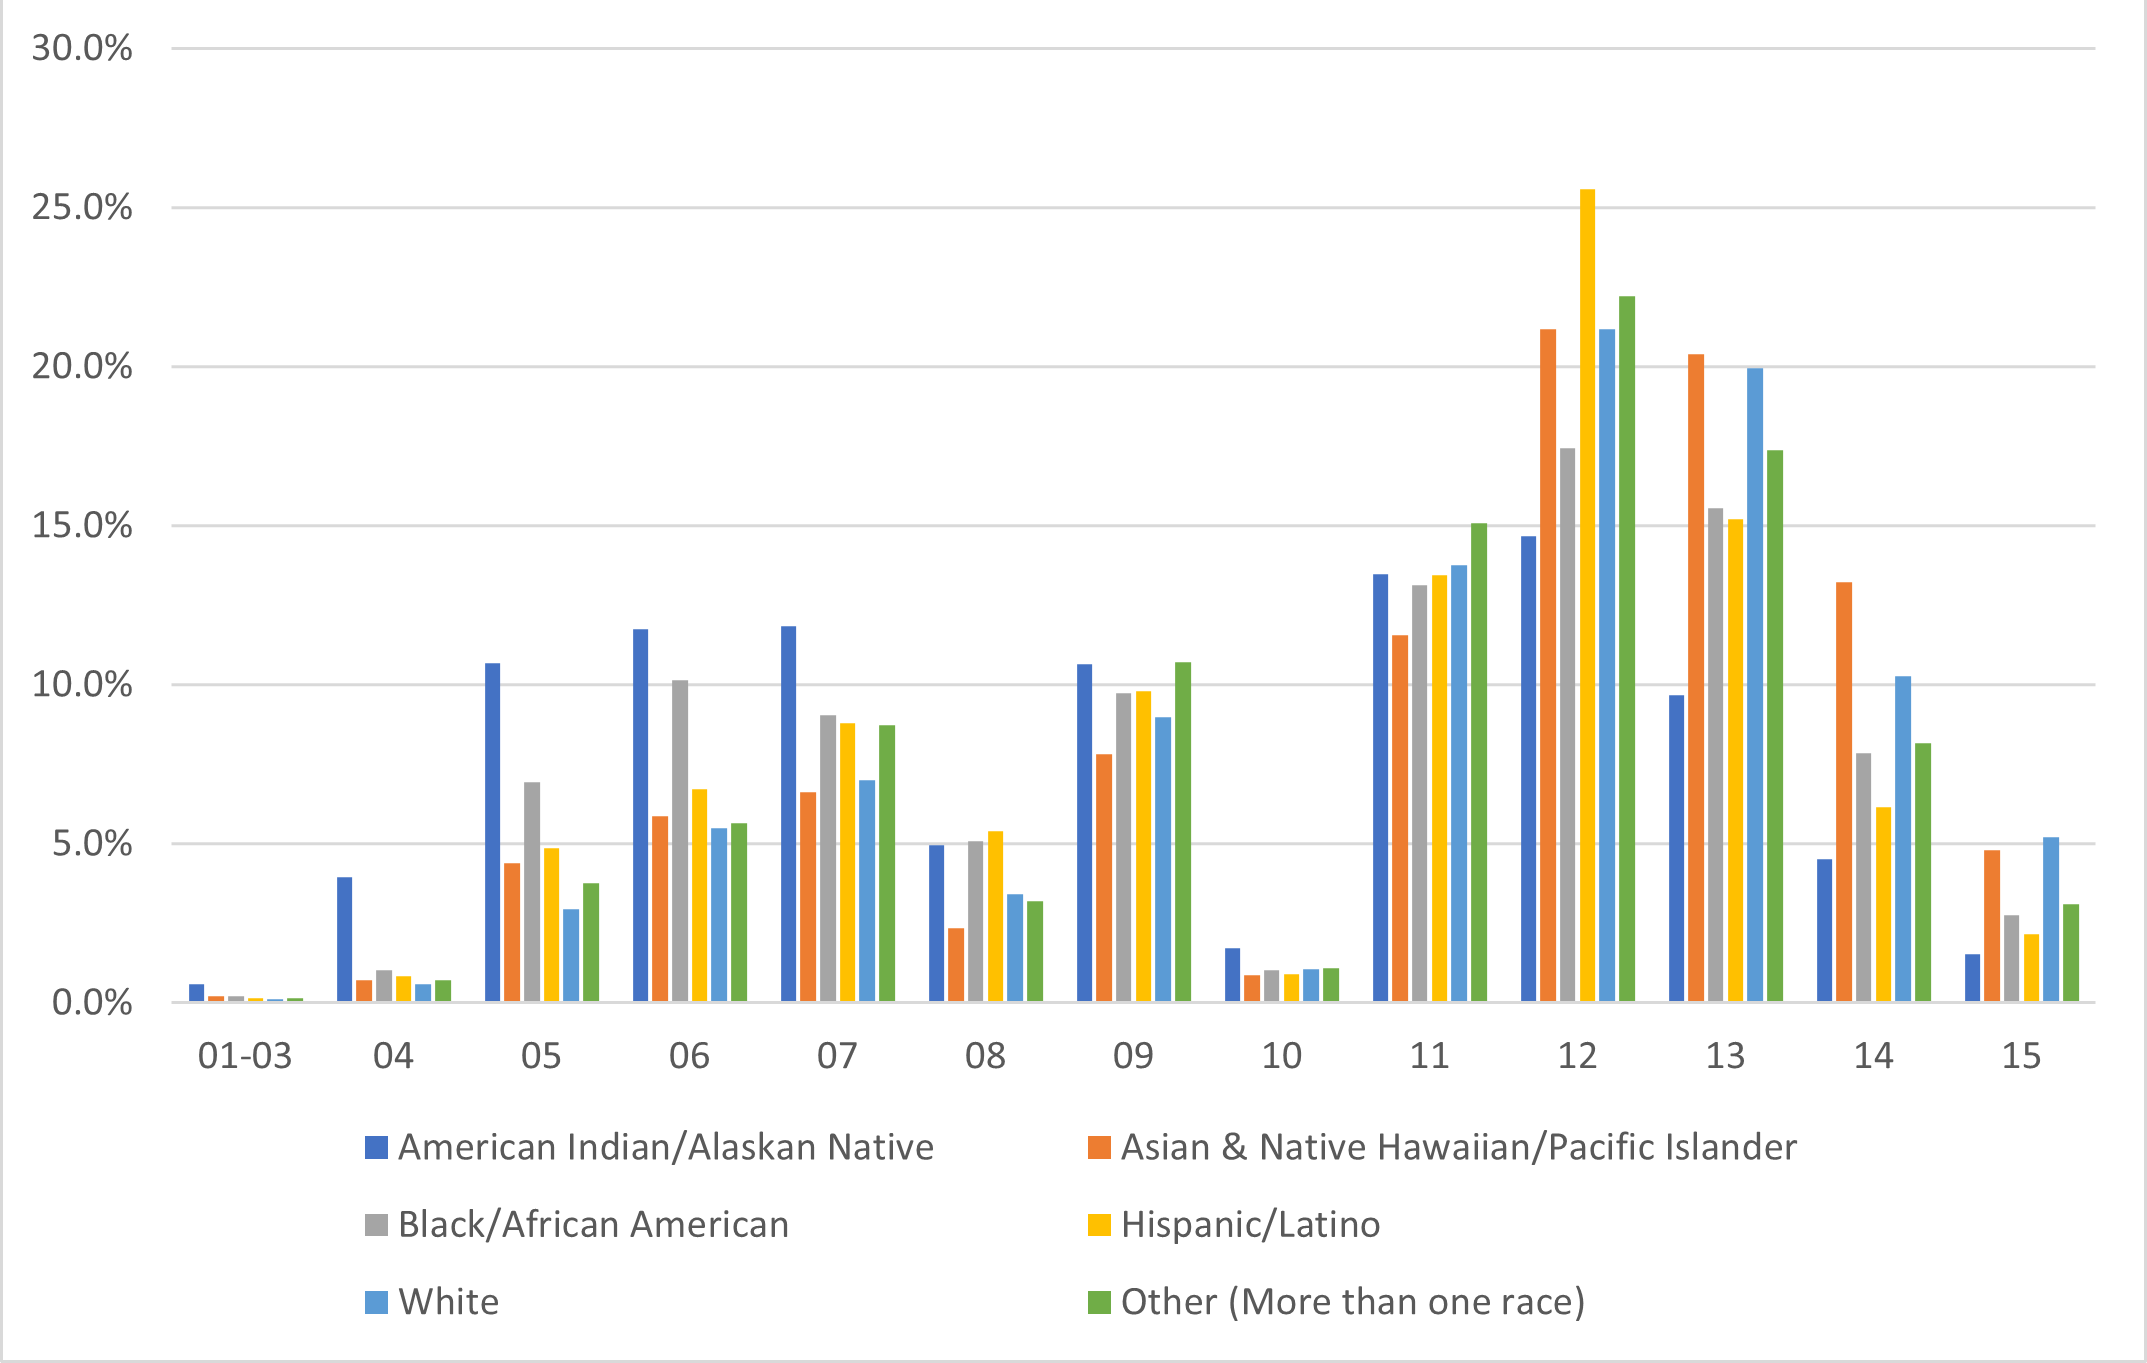
*Graph represents data found in Appendix 9
Gaps for GS Employees for Each Racial/Ethnic Group by Grade Level
For each racial/ethnic group and gender at each General Schedule grade, Appendix 10 shows the male average salary, female average salary, percent of White male average salary, and pay gaps relative to White males. The pay gaps varied depending on the subpopulation and grade level compared. We note that differences in average salary at various grades can reflect various factors, including (1) use of discretionary authority to set a newly hired employee's salary above step 1, (2) use of quality step increases, (3) how long the employee has been in the grade (which may relate to the employee's age and/or to whether the grade is a full performance level for the employee's occupation) and (4) whether the grade is a level in an employee's career ladder (which means the employee will generally be in that grade for 1-2 years and is more likely to have a lower step in that grade). Certain occupations have different career ladders and full performance levels; thus occupational distribution may explain some of the gaps between racial/ethnic group by GS grade level. In many cases, there is no pay gap for a subpopulation when compared to While males or the average salary of the subpopulation and gender exceeded the average salary of White males. For example—
- The average salary for American Indian/Alaskan Native males exceeded the average salary for White males at grades 1-3, 7, and 9-11. Pay gaps at the other grades ranged from 0.1 percent at grade 6 to 4.4 percent at grade 4.
- The average salary for American Indian/Alaskan Native females exceeded the average salary for White males at grades 1-3, 5-7 and 9-12. Pay gaps at the other grades ranged from 1.1 percent at grade 13 to 3.6 percent at grade 15.
- The average salary for males in the Asian & Native Hawaiian/Pacific Islander racial/ethnic group exceeded the average salary for White males at all grade levels except grades 1-3 (pay gap of 4.4 percent).
- The average salary for females in the Asian & Native Hawaiian/Pacific Islander racial/ethnic group exceeded the average salary for White males at all grade levels.
- The average salary for Black/African American males exceeded the average salary for White males at every grade except 10 (pay gap of 1.0 percent) and 12 (no pay gap).
- The average salary for Black/African American females exceeded the average salary for White males at every grade except 8 (pay gap of 1.6 percent)
- The average salary for Hispanic/Latino males exceeded the average salary for White males at grades 6-12. Pay gaps at the other grades ranged from 1.3 percent at grade 13 to 2.9 percent at grade 4.
- The average salary for Hispanic/Latino females exceeded the average salary for White males at grades 1-3, 6, and 9-12. Pay gaps at the other grades ranged from 0.2 percent at grade 4 to 2.6 percent at grade 8.
- The average salary for White females exceeded the average salary for White males at grades 6, 10, 11,13, and 15. The average salary for White females at grade 12 equaled the average salary for White males. Pay gaps at other grades ranged from 0.2 percent at grade 14 to 2.7 percent at grade 8.
- The average salary for Other (more than one race) males exceeded the average salary for White males at grade 5 and 6. Pay gaps at the other grades ranged from 0.6 percent at grades 7, 9, and 10, to 5.4 percent at grade 4.
- The average salary for Other (more than one race) females exceeded the average salary for White males at grades 6 and 10. There was no pay gap at grade 11. Pay gaps at the other grades ranged from 0.8 percent at grade 15 to 4.2 percent at grade 8.
Pay Gaps and Population Weighted Averages for each Racial/Ethnic Group by White Collar Occupational Series
Appendix 11 shows detailed data for subpopulations under the Occupational Series factor in 2022 (i.e., occupational series). This appendix also shows the population-weighted average percentage as a contrast to the overall raw percentage. (See discussion under Appendix 4.) The pay gaps (if any) varied depending on the subpopulation and occupational series. A high-level summary of pay gaps by subpopulation and occupational series group is provided below.
- The population-weighted percentages were 93.9 percent for American Indian/Alaskan Native males, 101.9 percent for Asian and Native Hawaiian/Pacific Islander males, 98.2 percent for Black/African American males, 96.8 percent for Hispanic/Latino males, and 94.0 percent for Other (more than one race) males. (See Table 11b in Appendix 11.)
- The population-weighted percentages were 97.5 percent for White females, 91.9 percent for American Indian/Alaskan Native females, 102.2 percent for Asian and Native Hawaiian/Pacific Islander females, 98.9 percent for Black/African American females, 94.9 percent for Hispanic/Latino females, and 92.6 percent for Other (more than one race) females. (See Table 11d in Appendix 11.)
- These percentages were greater than the corresponding overall raw percentage of White male average salary for White Collar employees in Appendix 6, apart from data for the Asian and Native Hawaiian/Pacific Islander racial/ethnic group for which salaries exceeded White male average salaries. The distribution of racial/ethnic groups across the occupational series groups appear to explain some of the racial/ethnic pay disparities.
- For 8 (14.3 percent) out of the 56 occupational series groups with American Indian/Alaskan Native male representation, the average American Indian/Alaskan Native male salary equaled or exceeded the White male average salary (i.e., was equal to or greater than 100 percent). For an additional 18 occupational series groups (32.1 percent), the American Indian/Alaskan Native male salary percentage was 95-99.9 percent. For 30 occupational series groups (53.6 percent), the American Indian/Alaskan Native male salary was less than 95 percent. (See Table 11e in Appendix 11.)
- For 71 (51.1 percent) out of the 139 occupational series groups with Asian and Native Hawaiian/Pacific Islander male representation, the average Asian and Native Hawaiian/Pacific Islander male salary equaled or exceeded the White male average salary (i.e., was equal to or greater than 100 percent). For an additional 49 occupational series groups (35.3 percent), the Asian and Native Hawaiian/Pacific Islander male salary percentage was 95-99.9 percent. For 19 occupational series groups (13.7 percent), the Asian and Native Hawaiian/Pacific Islander male salary was less than 95 percent. (See Table 11e in Appendix 11.)
- For 75 (37.3 percent) out of the 201 occupational series groups with Black/African American male representation, the average Black male salary equaled or exceeded the White male average salary (i.e., was equal to or greater than 100 percent). For an additional 84 occupational series groups (41.8 percent), the Black male salary percentage was 95-99.9 percent. For 42 groups (20.9 percent), the Black male salary was less than 95 percent. (See Table 11e in Appendix 11.)
- For 29 (18.1 percent) out of the 160 occupational series groups with Hispanic/Latino male representation, the average Hispanic/Latino male salary equaled or exceeded the White male salary (i.e., equal to or greater than 100 percent). For an additional 73 occupational series groups (45.6 percent), the Hispanic/Latino male salary percentage was 95-99.9 percent. For 58 groups (36.3 percent), the Hispanic/Latino male salary was less than 95 percent. (See Table 11e in Appendix 11.)
- For 12 (14.1 percent) out of the 85 occupational series groups with Other (more than one race) male representation, the average Other male salary equaled or exceeded the White male average salary (i.e., equal to or greater than 100 percent). For an additional 37 occupational series groups (43.5 percent), the Other male salary percentage was 95-99.9 percent. For 36 occupational series groups (42.4 percent), the Other male salary was less than 95 percent. (See Table 11e in Appendix 11.)
- For 78 (24.8 percent) out of the 314 occupational series groups with White female representation, the average White female salary equaled or exceeded the White male average salary (i.e., equal to or greater than 100 percent). For an additional 141 occupational series groups (44.9 percent), the White female salary percentage was 95-99.9 percent. For 95 occupational series groups (30.3 percent), the White female salary percentage was less than 95 percent. (See Table 11e in Appendix 11.)
- For 4 (7.1 percent) out of the 56 occupational series groups with American Indian/Alaskan Native female representation, the average American Indian/Alaskan Native female salary equaled or exceeded the White male average salary (i.e., equal to or greater than 100 percent). For an additional 17 occupational series groups (30.4 percent), the American Indian/Alaskan Native female salary percentage was 95-99.9 percent. For 35 occupational series groups (62.5 percent), the American Indian/Alaskan Native female salary percentage was less than 95 percent. (See Table 11e in Appendix 11.)
- For 59 (42.4 percent) out of the 139 occupational series groups with Asian and Native Hawaiian/Pacific Islander female representation, the average Asian and Native Hawaiian/Pacific Islander female salary equaled or exceeded the White male average salary (i.e., equal to or greater than 100 percent). For an additional 47 occupational series groups (33.8 percent), the White female salary percentage was 95-99.9 percent. For 33 occupational series groups (23.7 percent), the Asian and Native Hawaiian/Pacific Islander female salary percentage was less than 95 percent. (See Table 11e in Appendix 11.)
- For 77 (38.3 percent) out of the 201 occupational series groups with Black/African American female representation, the average Black female salary equaled or exceeded the White male average salary (i.e., equal to or greater than 100 percent). For an additional 67 occupational series groups (33.3 percent), the Black female salary percentage was 95-99.9 percent. For 57 occupational series groups (28.4 percent), the Black female salary percentage was less than 95 percent. (See Table 11e in Appendix 11.)
- For 28 (17.5 percent) out of the 160 occupational series groups with Hispanic/Latino female representation, the average Hispanic/Latino female salary equaled or exceeded the White male average salary (i.e., equal to or greater than 100 percent). For an additional 60 occupational series groups (37.5 percent), the Hispanic/Latino female salary percentage was 95-99.9 percent. For 72 occupational series groups (45.0 percent), the Hispanic/Latino female salary percentage was less than 95 percent. (See Table 11e in Appendix 11.)
- For 6 (7.1 percent) out of the 85 occupational series groups with Other (more than one race) female representation, the average Other female salary equaled or exceeded the White male average salary (i.e., equal to or greater than 100 percent). For an additional 27 occupational series groups (31.8%), the Other female salary percentage was 95-99.9 percent. For 52 occupational series groups (61.2%), the Other female salary percentage was less than 95 percent. (See Table 11e in Appendix 11.)
Conclusion
Regularly conducting pay equity audits to assess whether similarly situated individuals are equitably compensated for similar work is part of the equity roadmap contained in the Biden-Harris Administration Governmentwide DEIA strategic plan.10 OPM will continue to periodically analyze Governmentwide pay gap data. OPM will also be updating the guidance issued in 201511 on conducting gender data analysis to include also examining data by racial/ethnic group, similar to this Governmentwide data analysis.
The Federal Government strives to be a model employer, one that values DEIA. OPM will take further actions to support reducing gender and racial/ethnic pay gaps in the Federal Government, including submitting a report to the President describing any changes to Government-wide and agency-specific compensation practices recommended and adopted pursuant to section 12 of EO 14035.
Footnote 10
The White House. “Governmentwide Strategic Plan to Advance Diversity, Equity, Inclusion, and Accessibility in the Federal Workforce,” November 2021. https://www.whitehouse.gov/wp-content/uploads/2021/11/Strategic-Plan-to-Advance-Diversity-Equity-Inclusion-and-Accessibility-in-the-Federal-Workforce-11.23.21.pdf
Footnote 11
Office of Personnel Management. “Additional Guidance on Advancing Pay Equality in the Federal Government,” July 2015. https://www.chcoc.gov/content/additional-guidance-advancing-pay-equality-federal-government